Volatility: Types, Influencing Factors & How To Calculate

Financial markets are constantly changing, with prices moving up and down due to various factors. This affects how investors approach the market. One key concept that helps explain these price changes is volatility. So, what is volatility?
Volatility measures how much and how quickly an asset’s price changes over time. High volatility means prices can rise or fall rapidly, increasing risk. Low volatility means prices are more stable with smaller changes. Understanding volatility helps investors manage risk and make informed decisions.
In this guide, we’ll explore what volatility is. We’ll also discuss the types of volatility, how to calculate it, strategies to manage it and the impact of volatility on different markets.
Key Takeaways
- Understanding Volatility: Volatility measures how much and how quickly an asset’s price changes over time.
- High Volatility: High volatility indicates rapid price changes, increasing the risk for investors.
- Low Volatility: Low volatility suggests more stable prices with smaller fluctuations, reducing investment risk.
- Importance for Investors: Understanding volatility helps investors manage risk and make informed decisions about their investments.
- Importance for Investors: Understanding volatility helps investors manage risk and make informed decisions about their investments.
What Is Volatility?
Volatility is a measure of how much the price of an asset, like a stock or a commodity, changes over time. It is important as it helps investors understand the risk. High volatility means the price changes quickly and by a large amount. Low volatility means the price changes slowly and by a small amount.
For example, if a stock’s price moves from $10 to $15 in a short time, it has high volatility. If it moves from $10 to $11 over the same period, it has low volatility. Volatility is a key concept in managing finances as it helps investors understand the risk of an investment. High volatility usually means higher risk, while low volatility means lower risk.
Types Of Volatility

Volatility can be understood in different ways. It is important to know the different types because they each tell a different story about how an asset’s price might change. The three main types of volatility are Historical Volatility, Implied Volatility, and Realized Volatility. Each type helps investors in different ways.
Historical Volatility
Historical Volatility measures how much the price of an asset has moved in the past. It looks at past data to see how much the price has gone up or down over a certain time period. For example, if a stock’s price moved between $20 and $30 over the last year, that range is its historical volatility.
This type of volatility is useful for understanding past price movements. It helps investors see patterns in how an asset’s price has changed before. However, it does not predict future prices. It only shows what has happened in the past.
Implied Volatility
Implied Volatility is a measure of how much the market expects the price of an asset to change in the future. It is often used in options trading. For example, if a stock option has an implied volatility of 20%, it means the market expects the stock price to change by 20% in the future.
This type of volatility is based on market sentiment. It reflects what traders think will happen, not what has happened. Implied volatility can be higher in uncertain markets when people expect big price swings.
Realized Volatility
Realized Volatility is the actual volatility that happened over a specific period. It is calculated by looking at how much the asset’s price has changed during that time. For example, if a stock’s price changed by 10% over a month, that is its realized volatility for that month.
This type of volatility is similar to historical volatility, but it focuses on a specific period. Realized volatility is useful for understanding how much risk was actually present in that time frame. It shows what really happened, rather than what was expected.
How To Calculate Volatility?
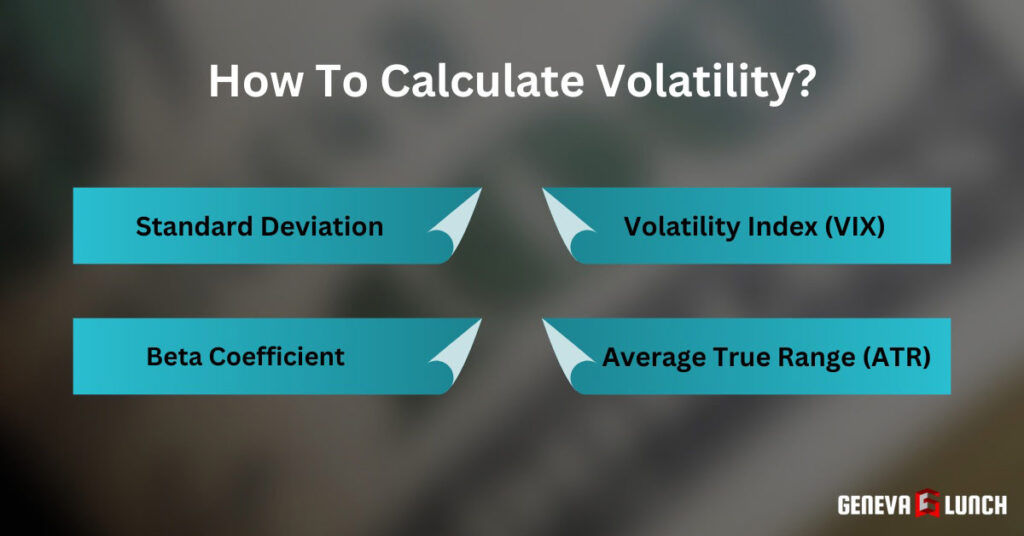
Calculating volatility is important for understanding how much an asset’s price might change. There are different ways to measure volatility. Each method gives a different view of the risk involved in an investment. The most common methods are Standard Deviation, Volatility Index (VIX), Beta Coefficient, and Average True Range (ATR). These tools help investors make informed decisions.
Standard Deviation
Standard Deviation is a common way to measure volatility. It shows how much the price of an asset varies from its average price. For example, if a stock’s price averages $50, but often moves between $45 and $55, the standard deviation helps show how much the price fluctuates.
To calculate it, you take the differences between each price and the average price, square them, find the average of those squares, and then take the square root. A higher standard deviation means higher volatility. This method is widely used because it provides a clear picture of price variation.
Volatility Index (VIX)
The Volatility Index, or VIX, measures the expected volatility of the stock market. It is often called the “fear gauge” because it shows how much people expect the market to move in the near future. For example, if the VIX is at 25, it means the market expects a 25% change in prices over the next year.
The VIX is calculated using options prices on the S&P 500 index. A higher VIX indicates more expected volatility, while a lower VIX suggests less expected volatility. It is a key tool for understanding market sentiment.
Beta Coefficient
The Beta Coefficient measures how much an asset’s price moves compared to the overall market. For example, if a stock has a beta of 1.5, it means the stock is 50% more volatile than the market. If the market goes up by 10%, the stock is expected to go up by 15%.
Beta is useful for comparing the volatility of a stock to the market as a whole. A beta greater than 1 indicates more volatility than the market, while a beta less than 1 indicates less volatility. This method helps investors understand how a stock might react to market changes.
Average True Range (ATR)
Average True Range (ATR) measures the average range of price movement over a specific period. It shows how much an asset’s price has moved, on average, each day. For example, if a stock has an ATR of $2, it means the stock’s price typically moves $2 per day.
To calculate ATR, you take the average of the true ranges over a set period, such as 14 days. The true range is the difference between the highest and lowest prices, or the difference between the previous close and the current high or low. A higher ATR means more volatility. ATR is useful for understanding how much an asset’s price can change in a given period.
Factors Influencing Volatility
Several factors can cause the price of an asset to change rapidly. These factors influence volatility in the market. The main factors include Economic Indicators, Corporate Earnings Reports, Political and Geopolitical Events, and Market Sentiment. Each of these factors can have a significant impact on how much and how quickly prices change. Let’s look at each factor in more detail.
Economic Indicators
Economic indicators are vital pieces of information that tell us how well an economy is performing. They include data on how much the economy is growing, how many people have jobs, and other key statistics. These indicators are closely watched by investors because they give clues about future market conditions.
GDP Reports
Gross Domestic Product (GDP) reports show how much a country’s economy is growing or shrinking. For example, if a country’s GDP grows by 3%, it means the economy is expanding.
A strong GDP report can lead to higher asset prices. A weak GDP report can cause prices to drop. Investors watch GDP reports closely because they signal economic strength or weakness.
Unemployment Rates
Unemployment rates measure the percentage of people who are not working but are looking for a job. For example, if the unemployment rate is 5%, it means 5 out of 100 people are jobless.
A high unemployment rate can lead to lower asset prices because it signals economic trouble. A low unemployment rate can lead to higher prices because it shows the economy is doing well. Changes in unemployment rates can increase market volatility.
Corporate Earnings Reports
Corporate earnings reports are official statements that companies release to show their financial performance over a period, typically every three months. These reports are important because they reveal how well a company is doing, which directly affects its stock price. Strong earnings can attract investors, driving prices up, while weak earnings can cause prices to fall.
Impact Of Earnings Surprises
Earnings surprises happen when a company reports profits that are much higher or lower than expected. For example, if a company is expected to earn $1 per share but reports $1.50, it is an earnings surprise.
This can cause the stock price to jump. When earnings are lower than expected, the price can drop. Earnings surprises often lead to high volatility as investors react to the news.
Quarterly Earnings Volatility
Quarterly earnings reports can cause volatility because they show how well a company is performing. For example, if a company shows strong earnings growth, its stock price may rise.
When earnings are weak, the price may fall. Investors closely watch these reports to decide whether to buy or sell stocks. Volatility can increase around the time these reports are released.
Political And Geopolitical Events
Political and geopolitical events include elections, government decisions, and international conflicts. These events can create uncertainty in the market, leading to increased volatility. Understanding how these events can impact the market is important for managing risk and making informed investment decisions.
Elections
Elections can cause volatility because they bring uncertainty about future policies. For example, if a new leader is expected to change economic policies, investors may react by buying or selling assets.
The uncertainty around the outcome can lead to big price swings in the market. Elections are closely watched by investors because they can have a major impact on market stability.
Trade Wars
Trade wars happen when countries impose tariffs or restrictions on each other’s goods. For example, if one country imposes a 25% tariff on imports, it can hurt businesses in both countries.
Trade wars can lead to higher volatility as companies and markets react to the changing trade environment. Prices of goods and stocks can fluctuate widely during trade wars.
Global Conflicts
Global conflicts, such as wars or military actions, can cause significant volatility. For example, if a conflict breaks out in a region that produces oil, oil prices may spike. This can lead to higher costs for businesses and consumers.
Global conflicts create uncertainty, and markets often react with sudden price changes. Investors may move their money to safer assets during these times.
Market Sentiment
Market sentiment refers to the overall mood or feeling of investors in the market. It plays a crucial role in driving price movements. When investors are optimistic, they tend to buy more assets, which can drive prices up. Conversely, when they are pessimistic, they may sell off assets, causing prices to drop.
Investor Behavior
Investor behavior can drive volatility. For example, if many investors start selling a stock, the price may drop quickly. When many investors start buying, the price can rise.
Investor behavior is influenced by news, reports, and other factors. When investors are uncertain or worried, they may react quickly, leading to high volatility.
Fear And Greed Index
The Fear and Greed Index measures the emotions of the market. It shows if investors are feeling fearful or greedy. For example, if the index is high, it means greed is driving the market, and prices may rise.
When the index is low, fear is driving the market, and prices may fall. The index helps predict how much volatility there might be based on investor emotions.
Media Influence
The media can influence market volatility by spreading news and opinions. For example, if the media reports a company is in trouble, investors may sell the stock, causing the price to drop.
Positive news can have the opposite effect. The media can create a sense of urgency or calm, influencing how quickly prices change. Media reports often contribute to short-term volatility in the market.
What Is The Impact Of Volatility On Different Asset Classes?
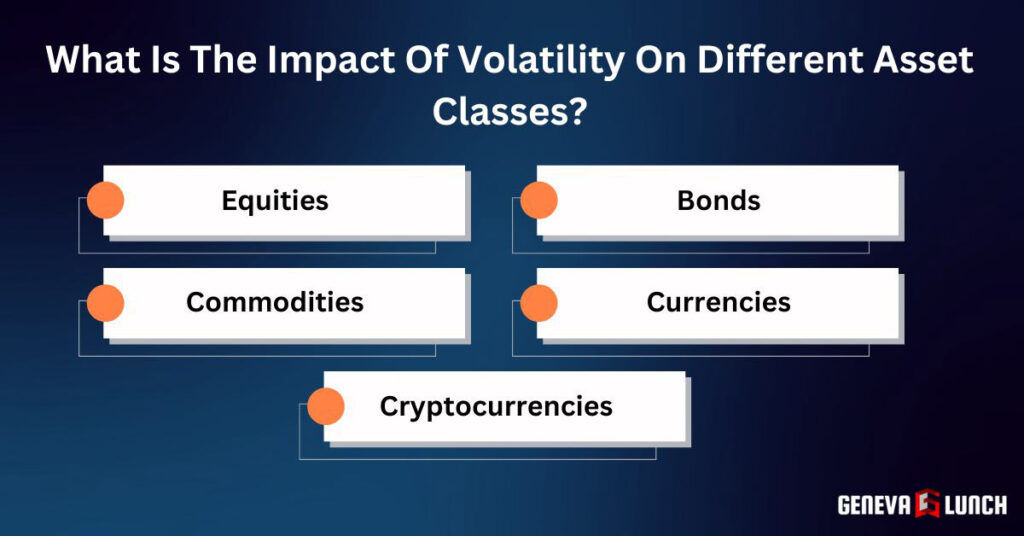
Volatility affects various asset classes in different ways. Understanding this impact helps investors make better decisions. Each asset class responds differently to changes in price stability. Let’s explore how volatility affects equities, bonds, commodities, currencies, and cryptocurrencies.
Equities
Equities, or stocks, are highly sensitive to volatility. When the stock market is volatile, stock prices can rise or fall quickly. For example, if a company announces strong earnings, its stock price may jump from $50 to $60 in a short time. On the other hand, bad news can cause the price to drop just as fast.
High volatility in equities often means higher risk for investors. However, it can also create opportunities to buy stocks at lower prices or sell them at higher prices.
Bonds
Bonds are generally considered safer than stocks, but they can still be affected by volatility. For example, if interest rates rise, bond prices may fall. A bond priced at $1,000 might drop to $950 during volatile times.
This happens because higher interest rates make existing bonds less attractive. Volatility in the bond market can lead to changes in bond prices and yields. However, bonds are usually less volatile than stocks, making them a more stable investment during uncertain times.
Commodities
Commodities, like oil, gold, and silver, can experience significant volatility. For example, if there is a sudden shortage of oil, its price might jump from $60 to $80 per barrel. Conversely, if there is an oversupply, the price might drop.
Volatility in commodities is often driven by supply and demand factors, geopolitical events, and changes in the global economy. Investors in commodities must be prepared for these price swings, which can be both a risk and an opportunity.
Currencies
Currencies are also impacted by volatility, especially in the foreign exchange market. For example, if the value of the US dollar drops against the euro, the exchange rate might change from 1.10 to 1.20 in a short period. Currency volatility can be caused by changes in interest rates, economic data, or political events.
Investors and businesses that deal with multiple currencies need to manage this volatility to protect against potential losses or take advantage of favorable exchange rates.
Cryptocurrencies
Cryptocurrencies are known for their high volatility. For example, the price of Bitcoin can move from $20,000 to $25,000 in a single day, or it can drop just as quickly. This extreme volatility makes cryptocurrencies both exciting and risky.
Unlike other asset classes, cryptocurrencies are still relatively new, and their prices can be influenced by market sentiment, regulatory news, and technological developments. Investors in cryptocurrencies must be prepared for large price swings, which can offer big gains or losses.
Volatility In Different Market Conditions
Volatility changes depending on the overall market conditions. It can be higher or lower based on whether the market is doing well or facing challenges. Understanding how volatility behaves in different market environments helps investors plan their strategies. Each type of market condition affects asset prices differently.
Bull Markets
In a bull market, prices of assets are generally rising. However, even in a bull market, volatility can occur. For example, if a stock is on an upward trend but suddenly drops by 5% in one day, this is volatility within a bull market.
Investors may feel confident and continue to buy, pushing prices higher. But sudden price drops can still happen. Volatility in a bull market is usually lower than in other conditions, but it is still important to monitor.
Bear Markets
In a bear market, prices are generally falling. Volatility is often higher during bear markets because investors are more uncertain. For example, if the stock market drops by 10% in a week, this is a sign of a bear market with high volatility.
Investors may sell off assets quickly, leading to rapid price declines. Volatility in a bear market can cause significant losses, making it a risky time for investors. Managing this risk is crucial during such periods.
Recessionary Periods
During a recession, the economy is shrinking, and volatility tends to increase. For example, during a recession, the price of a stock might drop from $100 to $70 quickly due to negative economic news. Investors often fear that companies will earn less, leading to more selling and lower prices.
Volatility in a recession can be severe as the market reacts to negative economic indicators like high unemployment or low consumer spending. It is a challenging time for investors.
Economic Booms
In an economic boom, the economy is growing rapidly, and volatility can be lower, but not absent. For example, if a stock steadily rises from $50 to $70 over several months, it shows low volatility in a booming economy.
Investors are generally optimistic, and asset prices tend to rise steadily. However, small periods of volatility can still occur if there is unexpected news or economic changes. Overall, volatility during economic booms is usually less intense compared to other conditions.
What Are Strategies For Managing Volatility?
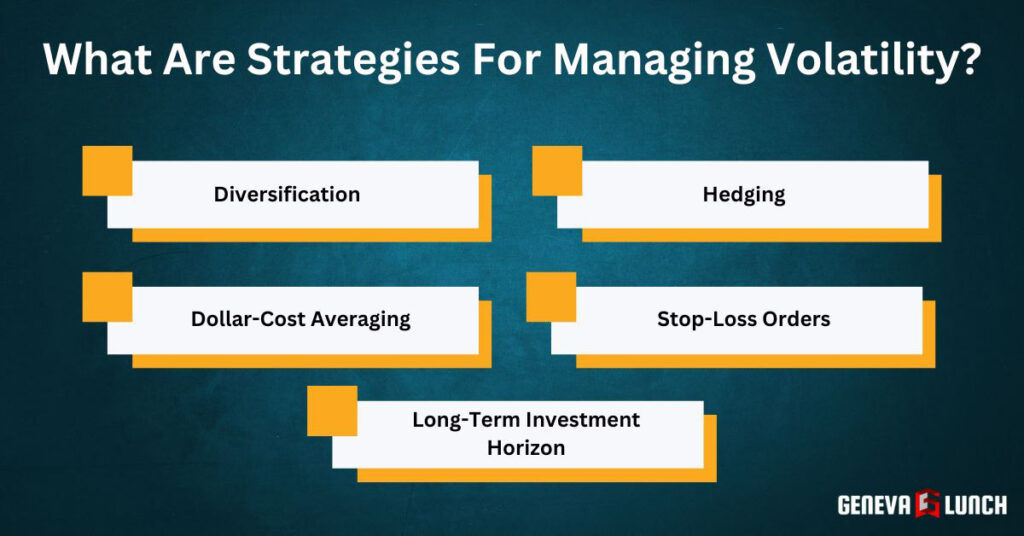
Volatility can cause the prices of investments to change rapidly. Managing this volatility is important to avoid large losses. There are several strategies that can help you manage these price changes. Each strategy provides a way to reduce risk and protect your investments.
Diversification
Diversification is a key strategy for managing volatility. It involves spreading your investments across different types of assets. For example, you might invest in stocks, bonds, and real estate instead of just one type of asset. When one investment loses value, others might still perform well.
For example, if the stock market drops, bonds might stay stable or increase in value. This reduces the overall risk of your portfolio. Diversification helps protect your investments because it spreads risk across different assets. This way, not all your money is affected by the same market changes.
Hedging
Hedging is another strategy to manage volatility. It involves using financial instruments like options or futures to protect against potential losses. For example, if you own stocks, you might buy a put option.
This option gives you the right to sell your stocks at a set price, even if the market price falls. When the stock price drops, the value of the put option increases, which offsets the loss. Hedging is like buying insurance for your investments. It can reduce the impact of volatility, but it might also involve additional costs.
Dollar-Cost Averaging
Dollar-cost averaging is a strategy where you invest a fixed amount of money regularly, regardless of the asset’s price. For example, you might invest $100 in a stock every month, no matter what the price is. When prices are low, your $100 buys more shares; when prices are high, it buys fewer shares.
Over time, this can lower the average cost of your investment. Dollar-cost averaging helps reduce the impact of volatility because it spreads out your investment over time. This strategy can help you avoid investing all your money at a time when prices are high.
Stop-Loss Orders
A stop-loss order is a tool that automatically sells your investment when its price falls to a certain level. For example, if you set a stop-loss order at $50 for a stock you bought at $60, the stock will be sold automatically if the price drops to $50.
This strategy helps limit your losses in a volatile market. Stop-loss orders are useful because they take emotion out of the decision-making process. They ensure that your losses are capped at a level you are comfortable with, helping you manage volatility effectively.
Long-Term Investment Horizon
A long-term investment horizon is a strategy where you focus on holding investments for many years. Instead of reacting to short-term price changes, you stay invested with the belief that prices will recover and grow over time. For example, even if the stock market drops today, you hold onto your investments because you expect them to increase in value over the next 10 or 20 years.
This strategy helps you ignore short-term volatility and focus on long-term growth. By looking at the bigger picture, you are less likely to make panic-driven decisions during volatile periods.
Psychological Aspects Of Volatility
Volatility not only affects prices but also impacts how people feel and act. Understanding the psychological aspects of volatility is important. When the market is volatile, emotions can drive actions more than logic. It is important to recognize how psychology influences behavior in different market conditions. Let’s explore how investors react to volatility and how behavioral finance explains these reactions.
Investor Behavior In Volatile Markets
Investor behavior changes when the market becomes volatile. People often react strongly to sudden price changes. This behavior can lead to mistakes that hurt their investments. It is important to understand these common reactions so you can avoid them. Let’s look at how fear and overconfidence affect investor behavior in volatile markets.
Fear And Panic Selling
Fear is a powerful emotion in volatile markets. When prices drop quickly, some investors panic and sell their investments. This is called panic selling. For example, if the stock market drops by 10% in one day, many people might sell their stocks to avoid further losses.
However, panic selling can lead to even bigger losses if prices recover later. It is important to stay calm and not make decisions based on fear. Investors should remember their long-term goals and avoid selling in a panic.
Overconfidence In Rising Markets
Overconfidence happens when investors believe they cannot lose. In a rising market, some investors think prices will keep going up. They may take more risks than usual, thinking they will always make money.
For example, if a stock has been going up for several weeks, an overconfident investor might buy more of it, expecting it to keep rising. However, markets can change quickly, and overconfidence can lead to big losses. It is important to stay realistic and not assume that prices will always go up.
Behavioral Finance Theories
Behavioral finance studies how psychology affects financial decisions. It explains why people sometimes make irrational choices in the market. Understanding these theories can help investors recognize their own biases. Let’s look at some key behavioral finance theories, including loss aversion, herding behavior, and recency bias.
Loss Aversion
Loss aversion is the idea that people feel the pain of losing money more strongly than the joy of gaining money. For example, losing $100 feels worse than gaining $100 feels good. This can cause investors to avoid selling a losing investment because they do not want to accept the loss.
They may hold onto a stock that is going down, hoping it will recover, even when it is better to sell. Understanding loss aversion can help investors make more rational decisions and avoid holding onto losing investments for too long.
Herding Behavior
Herding behavior happens when people follow what others are doing, even if it is not the best decision. In the market, this can mean buying a stock just because everyone else is buying it. For example, if a stock’s price is rising quickly and many people are buying it, others may jump in without doing their research.
This can create a bubble, where prices rise too high and then crash. Herding can lead to big losses if the market turns. It is important to do your own research and not just follow the crowd.
Recency Bias
Recency bias is when people focus too much on recent events and forget about the long-term picture. For example, if the market has been going up for a few weeks, investors might think it will keep going up forever. They may ignore signs that the market could change.
This bias can lead to poor investment decisions because it overlooks the bigger picture. It is important to remember that markets go through cycles and that recent trends do not always continue.
Managing Emotions
Managing emotions is crucial in a volatile market. When prices move quickly, it is easy to let fear or greed take over. However, making decisions based on emotions can lead to mistakes. It is important to stay calm and stick to your investment plan.
One way to manage emotions is to set clear goals and limits. For example, decide in advance when you will sell an investment or how much you are willing to lose. By having a plan, you can avoid making impulsive decisions that hurt your investments.
Volatility In Global Markets
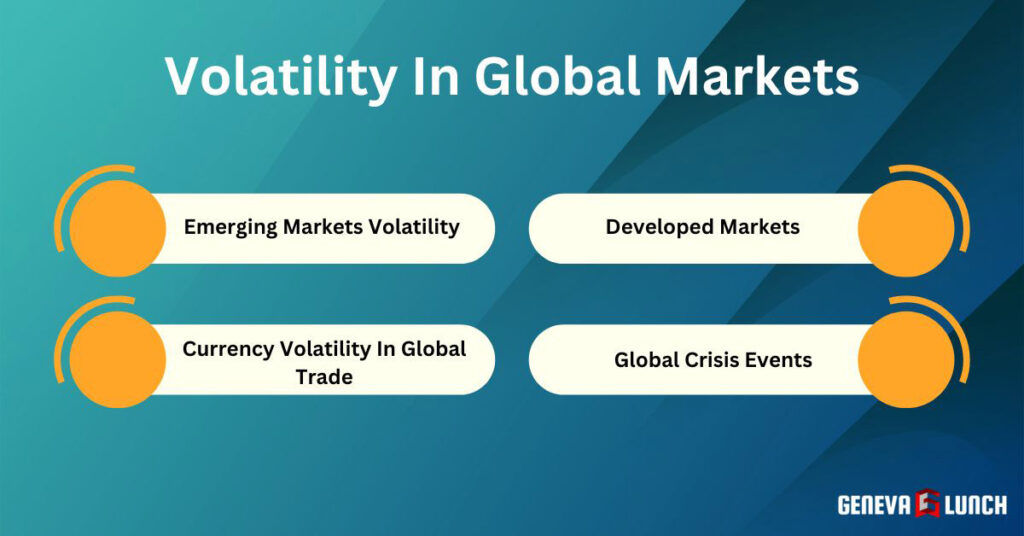
Volatility does not just affect one country. It can impact markets all over the world. Different markets experience volatility in different ways. Understanding how volatility works globally helps investors make better decisions. Knowing how global markets react to volatility can help protect investments.
Emerging Markets Volatility
Emerging markets are countries with growing economies, like Brazil, India, and China. These markets often have higher volatility. For example, stock prices in an emerging market might rise or fall quickly due to political changes or economic news. As these economies are still developing, they can be more sensitive to global events.
For example, if there is uncertainty in a large economy like the United States, it can cause big price swings in emerging markets. Investors need to be careful when investing in these markets because of the higher risk involved.
Developed Markets
Developed markets are found in countries with strong, stable economies, like the United States, Germany, and Japan. These markets generally have lower volatility compared to emerging markets. However, they can still experience significant price changes during global events.
For example, if there is a financial crisis, even developed markets can see rapid drops in stock prices. While these markets are usually more stable, they are not immune to volatility. Investors often see developed markets as safer, but they still need to manage risk carefully.
Currency Volatility In Global Trade
Currency volatility refers to changes in the value of one currency compared to another. For example, if the value of the US dollar drops against the euro, it can affect global trade. Companies that do business internationally may see their profits change due to currency movements.
For example, if a US company earns money in euros, a weaker dollar means more profit when converting back to dollars. Currency volatility can create opportunities but also risks. Businesses and investors need to monitor exchange rates closely to manage this volatility.
Global Crisis Events
Global crisis events, like financial crashes or pandemics, can cause extreme volatility in markets around the world. For example, during the 2008 financial crisis, stock markets in many countries saw huge drops in value. Similarly, the COVID-19 pandemic led to sharp declines and then rapid recoveries in global markets.
These crises create uncertainty, leading to large and sudden price movements. Investors must be prepared for increased volatility during global crises. Diversifying investments and staying informed about global events can help manage the risks during these times.
FAQs
What Is The Cause Of Market Volatility?
Market volatility happens when there are rapid and large changes in asset prices. Several factors can cause this. Economic news, like changes in interest rates or unemployment data, can make prices move quickly. Political events, such as elections or policy changes, can also cause volatility.
How Can I Protect My Portfolio During Volatile Periods?
To protect your portfolio during volatile periods, diversify your investments. This means spreading your money across different asset types, like stocks, bonds, and real estate. Also, to protect financial portfolios, you can invest in safer assets, which are less affected by volatility.
What Is The Difference Between Historical And Implied Volatility?
The difference between historical and implied volatility is in their focus. Historical volatility measures past price changes, while the implied volatility predicts future price changes based on market expectations. Historical volatility looks backward, while implied volatility looks forward.
Can Volatility Be Used To Predict Future Market Movements?
Volatility itself cannot predict exact future market movements, but it gives clues about potential risks. High volatility suggests that prices may continue changing, which could mean higher risk. Low volatility suggests a more stable market, however, that doesn’t guarantee future stability.
How Does Volatility Affect Investment Risk?
Volatility increases investment risk because it means prices can change quickly and unpredictably. When volatility is high, the value of your investments can rise or fall sharply in a short time. This makes it harder to predict the returns and increases the chance of losing money.
How Do Central Banks Influence Market Volatility?
Central banks influence market volatility through their monetary policies. When they change interest rates, it can cause asset prices to move. Central banks also use tools like quantitative easing to inject money into the economy, which can affect market stability. It often leads to increased volatility.
Conclusion
Volatility is an important concept in investing. It measures how much and how quickly prices change, affecting the risk and potential returns of an investment. By understanding volatility, investors can better manage their portfolios and make informed decisions. Whether dealing with high or low volatility, knowing how to handle these changes is key to successful investing.