Income Statement: How To Analyze Profitability

Every business needs to measure its financial performance regularly. This helps owners and managers make important decisions about growth, spending, and investments. One essential tool for this is the income statement, a key report used by all types of businesses. So, what is an income statement?
An income statement is a financial report that shows a company’s earnings and expenses over a set period, like a month or year. It calculates whether the business made a profit or a loss. This report can also help the owners and the investors understand how well their company is performing financially.
In this guide, we’ll explore the parts of an income statement. We’ll also discuss how it works, and why it is a vital tool for managing a company’s finances effectively.
Key Takeaways
- Financial Overview: An income statement shows a company’s revenues, expenses, and profits over a specific period.
- Informed Decision-Making: Businesses use income statements to make informed financial decisions and improve profitability.
- Assessing Financial Health: It helps assess a company’s financial health by tracking earnings and operational costs.
- Tracking Profitability: Income statements allow businesses to monitor their profitability and control operational expenses effectively.
- Periodic Financial Reporting: Typically prepared monthly, quarterly, or annually, income statements help track performance over time.
What Is An Income Statement?
An income statement is a financial document that shows a company’s finances including their earnings and expenses over a period of time. The income statement reports how much money a company made (revenue) and how much it spent (expenses). The main goal is to show if a company made a profit or a loss.
For example, if a company earns $100,000 in revenue and has $60,000 in expenses, its profit would be $40,000. Income statements help businesses track their performance. It usually covers a month, quarter, or year.
Components Of An Income Statement
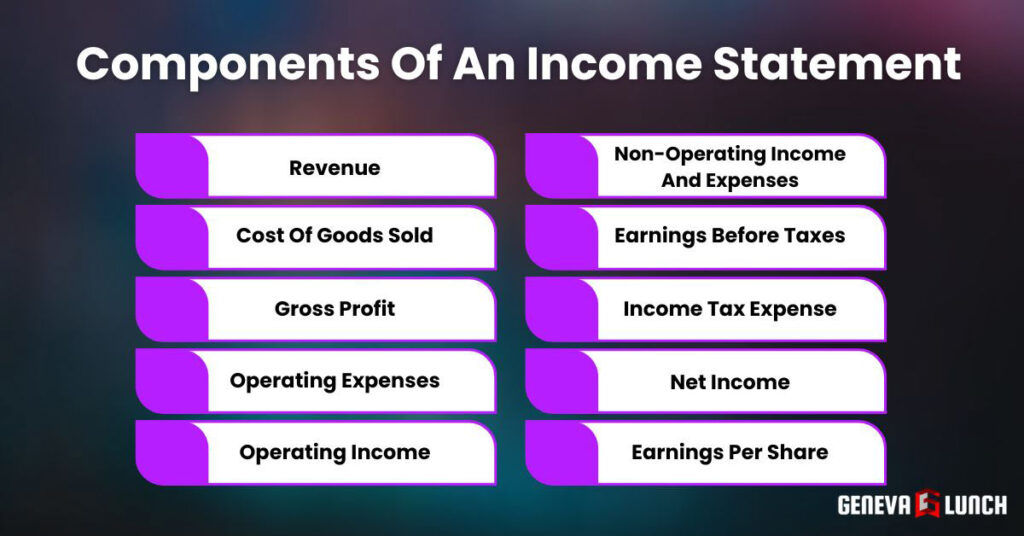
An income statement has many parts. Each part helps show the company’s financial performance. The main sections include revenue, costs, and profit. These sections are broken down into smaller components.
Revenue
Revenue is the total amount of money a company makes from its business activities. It is often called “sales” or “income.” For example, if a company sells products worth $500,000, that is its revenue.
Revenue is the first item on an income statement. It shows how much the company has earned before any costs are taken out. A company with higher revenue usually has more money to cover expenses and earn a profit.
Cost Of Goods Sold (COGS)
COGS stands for Cost of Goods Sold. It includes all the direct costs of making a product or offering a service. This includes materials and labor.
For example, if a company spends $200,000 to produce goods that it sells for $500,000, its COGS is $200,000. Subtracting COGS from revenue shows the gross profit. COGS is important because it helps measure how much it costs to make the products or services that bring in revenue.
Gross Profit
Gross profit is the money a company makes after subtracting COGS from revenue. It shows how efficiently a company is producing and selling goods or services. For example, if a company has $500,000 in revenue and $200,000 in COGS, the gross profit would be $300,000.
Gross profit is an important measure of a company’s profitability before accounting for other expenses.
Operating Expenses
Operating expenses include all the costs a company must pay to run its day-to-day operations. These are not related to making the product. Examples include rent, utilities, salaries, and marketing costs.
When a company spends $100,000 on rent, $50,000 on salaries, and $20,000 on utilities, those are its operating expenses. These expenses are subtracted from gross profit to calculate operating income.
Operating Income
Operating income is the profit a company makes from its regular business activities. It is calculated by subtracting operating expenses from gross profit.
For example, if a company has $300,000 in gross profit and $170,000 in operating expenses, its operating income would be $130,000. This shows how much profit the company is making from its core business.
Non-Operating Income And Expenses
Non-operating income and expenses are the money a company earns or spends outside its regular business operations. Examples include interest earned from investments or money spent on a lawsuit.
For example, if a company earns $10,000 in interest but spends $5,000 on a legal case, the non-operating income would be $5,000. This section shows the financial activities that are not related to the company’s main business.
Earnings Before Taxes (EBT)
Earnings Before Taxes (EBT) is the amount of money a company has earned before paying taxes. It is calculated by adding or subtracting non-operating income and expenses from operating income.
For example, if a company has $130,000 in operating income and $5,000 in non-operating income, its EBT would be $135,000. EBT is important because it shows how much profit a company has before taxes.
Income Tax Expense
Income tax expense is the amount of money a company must pay in taxes. This amount is based on the company’s earnings before taxes.
For example, if a company’s EBT is $135,000 and the tax rate is 20%, the company would pay $27,000 in taxes. This tax expense is subtracted from EBT to calculate the net income.
Net Income
Net income is the final profit a company makes after all expenses are deducted, including taxes. It shows how much money the company has left after paying for everything.
For example, if a company has $135,000 in EBT and pays $27,000 in taxes, its net income would be $108,000. Net income is a key measure of a company’s financial health.
Earnings Per Share (EPS)
Earnings Per Share (EPS) is the portion of a company’s profit that is allocated to each share of stock. It is calculated by dividing net income by the number of shares outstanding.
For example, if a company has a net income of $108,000 and 10,000 shares, the EPS would be $10.80 per share. EPS helps investors understand how profitable a company is compared to the number of shares it has issued.
Formats Of Income Statements
There are different ways to organize an income statement. Companies can choose from several formats depending on their needs. The most common formats are the single-step income statement, the multi-step income statement, and the comparative income statement. Each format gives different details about a company’s finances.
Single-Step Income Statement
A single-step income statement is simple and easy to understand. It lists all revenues together and then lists all expenses together. The difference between the two gives the net income.
For example, if a company has $500,000 in revenue and $400,000 in expenses, its net income would be $100,000. This format is often used by small businesses. It does not separate operating and non-operating items, making it very straightforward.
Multi-Step Income Statement
A multi-step income statement is more detailed than a single-step format. It separates operating and non-operating income and expenses. For example, it shows gross profit, operating income, and net income separately.
When a company earns $500,000 in revenue, has $200,000 in COGS, and $170,000 in operating expenses, it will show these amounts step by step. This format helps show how much money comes from regular business activities versus other sources.
Comparative Income Statement
A comparative income statement shows the financial performance of a company over different periods. It lists the income statements for two or more periods side by side.
This helps compare how the company is doing from one period to the next. It is useful for seeing trends and understanding how the business is growing or changing over time.
Analysis Of Income Statement

Analyzing an income statement helps people understand a company’s financial health. It allows them to see how well the company is doing. Common methods include ratio analysis, vertical analysis, horizontal analysis, and trend analysis. Each method provides different insights.
Ratio Analysis
Ratio analysis uses numbers from the income statement to calculate different ratios. These ratios help measure the company’s performance. Here are some important ratios.
Gross Profit Margin Ratio
The gross profit margin ratio shows how much money a company makes after paying for the cost of goods sold (COGS). It is calculated by dividing gross profit by revenue.
For example, if a company has $300,000 in gross profit and $500,000 in revenue, the gross profit margin ratio would be 60%. This ratio shows how efficiently a company is producing its products.
Operating Profit Margin Ratio
The operating profit margin ratio measures how much profit a company makes from its core business. It is calculated by dividing operating income by revenue.
For example, if a company has $130,000 in operating income and $500,000 in revenue, the operating profit margin would be 26%. This ratio helps show how well the company is controlling its operating costs.
Net Profit Margin Ratio
The net profit margin ratio shows how much profit a company makes after all expenses are paid, including taxes. It is calculated by dividing net income by revenue.
For example, if a company has $108,000 in net income and $500,000 in revenue, the net profit margin ratio would be 21.6%. This ratio shows the overall profitability of the company.
Earnings Per Share (EPS)
Earnings Per Share (EPS) is the amount of profit a company earns for each share of stock. It is calculated by dividing net income by the number of shares.
For example, if a company has a net income of $108,000 and 10,000 shares, the EPS would be $10.80 per share. This ratio helps investors know how much profit each share earns.
Vertical Analysis
Vertical analysis helps compare each item on the income statement as a percentage of total revenue. It shows how much each expense or profit contributes to the overall income. This allows for easy comparison of different expense categories and profit levels.
Purpose
The purpose of vertical analysis is to show the relationship of each line item to total revenue. For example, if operating expenses are 30% of total revenue, vertical analysis will highlight this clearly. This helps to evaluate the proportion of different costs and identify areas that may need improvement.
Application In Financial Analysis
Vertical analysis is used in financial analysis to spot trends or unusual changes in financial data. When certain expenses suddenly take up a larger percentage of revenue, this could indicate inefficiency or rising costs.
By using vertical analysis, businesses can more easily identify areas that need improvement, such as controlling operating expenses or increasing gross profit margins.
Horizontal Analysis
Horizontal analysis compares financial data over multiple periods to identify trends and patterns. By looking at the changes in revenue, expenses, and profits over time, horizontal analysis helps businesses understand their growth and financial performance over time. This method helps spot positive or negative trends that may not be obvious from looking at a single period.
Purpose
The purpose of horizontal analysis is to measure growth or decline. It shows how revenue, expenses, or profits are increasing or decreasing over time.
For example, if a company’s revenue grows by 10% over two years, while its expenses grow by 20%, this indicates potential issues with cost management.
Application In Financial Analysis
In financial analysis, horizontal analysis helps companies and investors see trends over time. For example, if a company’s revenue grows by 10% each year, it shows strong growth. Horizontal analysis is useful for long-term planning and making informed decisions about resource allocation and investment.
Trend Analysis
Trend analysis examines financial data over several periods to identify consistent patterns. It is useful for forecasting future financial performance and spotting long-term trends. It is an important tool for predicting future revenue, expenses, and profits.
Importance In Financial Forecasting
Trend analysis is important for predicting future performance. It helps companies plan for the future by spotting trends in revenue, expenses, and profits. This helps businesses set realistic goals, manage resources, and plan for future investments.
How To Conduct Trend Analysis?
To conduct trend analysis, compare the financial data from several periods. Start by identifying key metrics such as revenue, operating income, and net income. Then, calculate the percentage change for each metric over the selected time frame.
Analyzing these trends will help businesses understand where they are heading and make necessary adjustments to their strategies for future success. Trend analysis helps with forecasting future revenue and expenses.
Real-World Applications Of Income Statements
Income statements are important tools in the real world. They help businesses, investors, lenders, and regulators understand a company’s financial health. Companies use income statements for different purposes, such as planning and decision-making. Investors look at income statements to decide if they want to buy stock in a company.
Corporate Financial Planning
Companies use income statements to plan their corporate finance for the future. The statement helps them understand how much money they are making and spending. For example, a company might see that its operating expenses are too high.
By using the income statement, the company can decide to cut costs or invest more in profitable areas. It helps businesses make better decisions about growth and investments.
Investment Decision-Making
Investors use income statements to decide whether to invest in a company. They look at things like revenue, net income, and earnings per share (EPS).
For example, if a company shows consistent revenue growth, it might be a good investment. Investors also use ratios like the net profit margin to see how profitable the company is. A strong income statement can attract more investors, while a weak one might push them away.
Credit Analysis By Lenders
Lenders, like banks, use income statements to decide if they should lend money to a company. They look at how much profit the company is making and whether it can pay back loans.
For example, if a company has strong earnings and low debt, a bank may be more likely to approve a loan. Income statements help lenders assess the risk of lending money to businesses.
Regulatory Reporting And Compliance
Regulatory agencies require companies to provide income statements to ensure they follow financial laws. For example, in the United States, companies must report their income statements to the Securities and Exchange Commission (SEC).
These reports help regulators make sure companies are honest about their financial performance. Failing to provide accurate income statements can lead to fines or other penalties. This makes income statements important for legal compliance.
Limitations Of Income Statements
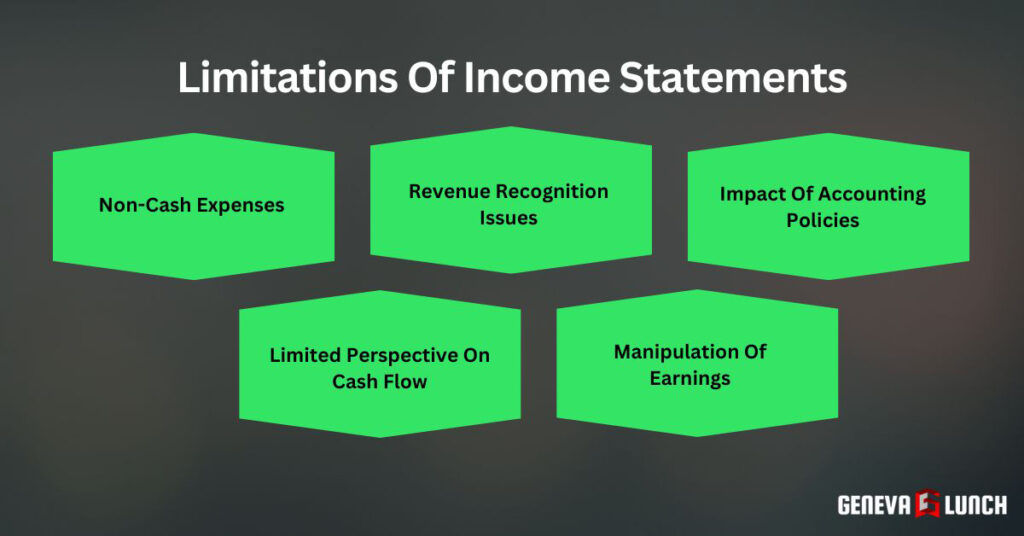
Income statements are very useful, but they also have some limitations. They do not always give a complete picture of a company’s financial health. There are certain things that income statements cannot show, or they can be affected by different accounting methods. It’s important to understand these limitations when analyzing an income statement.
Non-Cash Expenses (E.g., Depreciation)
Income statements include non-cash expenses like depreciation. Depreciation is when the value of an asset decreases over time. For example, a company may reduce the value of its machinery by $10,000 each year.
This expense is recorded on the income statement, but no actual cash is spent. Because of this, the income statement may show lower profits even though the company didn’t lose cash.
Revenue Recognition Issues
Income statements can have issues with recognizing revenue. Sometimes, companies record revenue before they actually receive the cash. For example, a company might report a sale in one period, but the payment comes in the next period.
This can make the company’s revenue appear higher in one period and lower in the next. It may not give a clear picture of when the company truly earned the money.
Impact Of Accounting Policies
Different accounting policies can change how items are recorded on the income statement. For example, some companies may choose different methods for valuing their inventory or calculating depreciation.
These differences can change the results of the income statement. As a result, it can be hard to compare income statements from two companies that use different accounting policies.
Limited Perspective On Cash Flow
An income statement does not provide a full view of a company’s cash flow. It shows profits, but not how much cash the company actually has on hand. For example, a company could show a profit on its income statement but have little cash because of unpaid invoices. It is important to also look at the cash flow statement, which shows the movement of cash in and out of the business.
Manipulation Of Earnings (Earnings Management)
Some companies may manipulate their earnings to make their income statement look better. This is called earnings management. For example, a company could delay recording expenses or speed up revenue recognition to show higher profits.
This can mislead investors or lenders about the company’s true financial health. Income statements should be viewed carefully to make sure the numbers are accurate and not manipulated.
How To Prepare An Income Statement
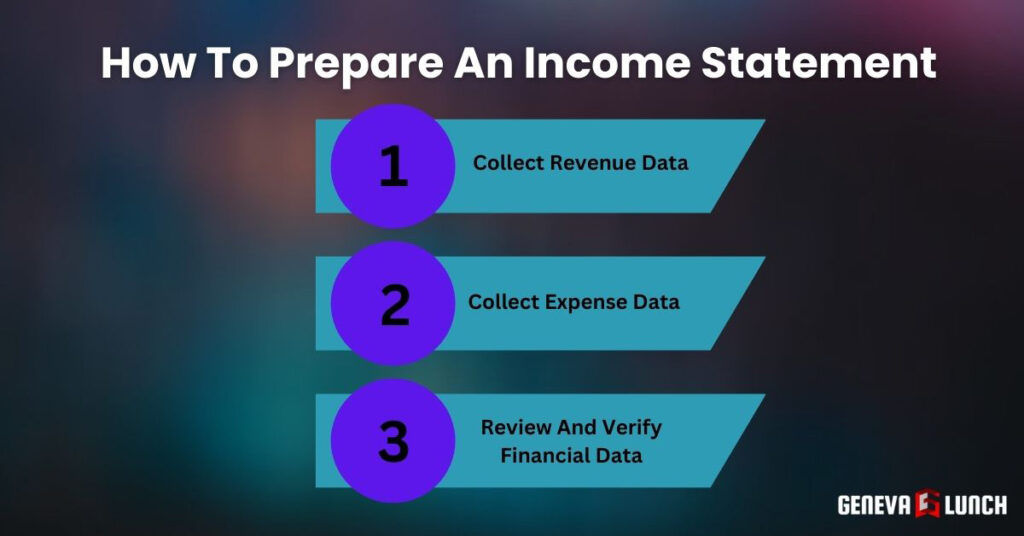
Preparing an income statement involves multiple steps. First, gather all revenue and expense data. This includes everything the company earns and spends. Once all data is collected, the next step is to carefully organize it into categories. This will help show the company’s financial performance clearly.
Collect Revenue Data
Revenue is the total money a company earns from its business activities. To prepare an income statement, you need to collect information about all sources of revenue. Revenue can come from product sales, services provided, and other sources like investments.
It is important to collect accurate revenue data because it is the first item on the income statement. By gathering this information, you can get a clear picture of how much the company is earning from different activities.
Sales Revenue
Sales revenue is the money a company earns from selling its products. For example, if a company sells 1,000 units of a product at $100 each, it will record $100,000 as sales revenue. This is the main source of revenue for most companies.
Sales revenue is important because it shows how much money the company earns directly from its main products or services. It is usually the first number listed on the income statement, and it provides the foundation for calculating profit.
Service Revenue
Service revenue comes from services the company provides to its customers. For example, if a consulting company charges $50,000 for its services in a month, that amount is recorded as service revenue.
Service revenue is important for companies that offer services instead of physical products. This could include consulting, repairs, or professional advice. Just like sales revenue, it is important to collect this information carefully to ensure the income statement is accurate.
Other Income Sources
Other income includes money earned from activities outside the company’s main business. This could be income from investments, renting out property, or interest earned. For example, if a company earns $5,000 in interest from a savings account, that amount is recorded as other income.
Other income is usually a small part of the income statement, but it is still important. It shows how much the company earns from non-business activities, which can help boost overall revenue.
Collect Expense Data
Expenses are the costs the company needs to pay to run its business. To prepare an income statement, you need to collect all expense data. Expenses are usually divided into different categories, such as the cost of goods sold (COGS), operating expenses, and non-operating expenses. Collecting accurate expense data is important because these numbers are used to calculate the company’s profit.
Cost Of Goods Sold (COGS)
COGS includes all the direct costs involved in producing the goods that the company sells. For example, if a company spends $60,000 on raw materials and labor to produce goods that it sells for $100,000, the COGS is $60,000. COGS is subtracted from revenue to calculate the company’s gross profit.
It is important to accurately collect COGS data because it shows how much it costs the company to produce its products. A lower COGS means higher profit.
Operating Expenses
Operating expenses are the costs required to run the day-to-day operations of the business. This includes things like rent, utilities, and employee salaries.
For example, if a company spends $30,000 on rent, $10,000 on utilities, and $40,000 on salaries, these are all operating expenses. Operating expenses are subtracted from gross profit to calculate operating income. Collecting accurate operating expense data is important because it helps the company understand how much it is spending on regular business activities.
Non-Operating Expenses
Non-operating expenses are costs that are not related to the company’s core business operations. This could include things like interest payments on loans or legal fees. For example, if a company pays $3,000 in interest on a loan, that is a non-operating expense.
These expenses are important because they can impact the company’s overall profitability. Non-operating expenses are listed separately from operating expenses to give a clearer picture of how much the company is spending on non-business activities.
Taxes
Taxes are the money the company must pay to the government. The amount of taxes a company owes depends on its earnings before taxes (EBT). For example, if a company has $100,000 in EBT and the tax rate is 20%, the company would owe $20,000 in taxes. Taxes are subtracted from earnings before taxes to calculate net income.
It is important to include taxes in the income statement because they can have a significant impact on the company’s final profit.
Review And Verify Financial Data
After collecting all revenue and expense data, the next step is to review and verify the information. This helps ensure that the income statement is accurate and reliable.
Reviewing financial data involves double-checking the numbers and making sure they are correct.
Ensure Accuracy
Ensuring accuracy means carefully checking all the numbers in the income statement. Even small errors can affect the final profit calculation. For example, if a company accidentally records $10,000 as $100,000, it will show a much larger profit than it actually earned.
To prevent mistakes, it is important to go over the data multiple times. This helps ensure that the income statement gives an accurate picture of the company’s financial performance.
Reconcile With Supporting Documents
Verifying data with supporting documents is important. Reconciling financial data with supporting documents means checking that the numbers in the income statement match other records, such as receipts, bank statements, and invoices.
For example, if the income statement shows $50,000 in sales revenue, the company should have receipts or invoices to support this number. Verifying data with supporting documents is important because it helps ensure that the information is accurate and reliable.
Common Income Statement Mistakes To Avoid
When preparing an income statement, it’s important to avoid common mistakes. These mistakes can lead to incorrect financial results. Even small errors can make the income statement less reliable. Let’s look at some common mistakes and how to avoid them.
Misclassifying Revenues Or Expenses
One common mistake is misclassifying revenues or expenses. For example, recording service revenue as sales revenue or listing a non-operating expense as an operating expense. This can give a wrong idea of the company’s financial performance.
To avoid this, make sure to correctly categorize all revenues and expenses. It’s important to understand the difference between operating and non-operating items.
Ignoring Non-Operating Items
Non-operating items, like interest expenses or income from investments, should not be ignored. Some companies only focus on operating revenues and expenses. However, non-operating items can have a big impact on net income.
For example, if a company earns $5,000 in interest from investments, it should include that amount on the income statement. Always include non-operating items to get a complete picture of the company’s financial situation.
Overlooking Depreciation And Amortization
Depreciation and amortization are non-cash expenses that reduce the value of assets over time. Some companies forget to include these expenses in the income statement.
For example, if a company has equipment that loses $10,000 in value each year, this should be recorded as depreciation. Overlooking depreciation or amortization can make the income statement look better than it really is. Always remember to account for these expenses.
Errors In COGS Calculation
Cost of Goods Sold (COGS) is an important part of the income statement. Mistakes in calculating COGS can lead to incorrect gross profit. For example, if a company forgets to include the cost of materials or labor, its COGS will be too low.
This will make gross profit appear higher than it really is. To avoid this, carefully calculate all the costs related to producing goods or services. Always double-check COGS calculations to ensure accuracy.
FAQs
1. How Can I Get An Income Statement?
You can get an income statement from a company’s financial reports. Public companies need to share these reports, which are often found on their website or filed with regulatory bodies like the SEC. Private companies may also provide them upon request, this is especially for the investors or lenders.
2. Can An Income Statement Show A Loss?
Yes, an income statement can show a loss when a company’s total expenses are greater than its total revenue for a specific period. This indicates that the company has spent more money than it earned during that time. Loss on the income statement reflects negative financial performance for the period.
3. How Often Is An Income Statement Prepared?
Income statements are prepared on a monthly, quarterly and annual basis. Monthly income statements help businesses monitor their financial performance regularly. Public companies are required to prepare and report quarterly and annual income statements to meet regulatory requirements and inform investors.
4. What Is The Difference Between An Income Statement And A Cash Flow Statement?
An income statement shows a company’s revenue, expenses, and profits during a specific period. In contrast, a cash flow statement focuses solely on the cash moving in and out of the business. The income statement includes non-cash items, while the cash flow statement focuses only on cash transactions.
5. How Do You Read And Interpret An Income Statement?
To read an income statement, look at the total revenue to see how much money the company earned. Then review the expenses to see how much the company spent. The difference between revenue and expenses gives the net income or net loss. The statement helps assess a company’s profitability and financial health.
Conclusion
An income statement is a crucial financial report for any business. It provides a clear picture of a company’s revenues, expenses, and profits over a specific period. By understanding and analyzing an income statement, businesses can make better financial decisions, track their profitability, and plan for future growth. Regularly reviewing this report helps ensure a company stays financially healthy.