Financial Analysis: Definition, Types, Ratios and Examples
In today’s complex economic environment, managing financial health is crucial for everyone from individual investors to large corporations. Effective financial management requires thorough understanding and careful assessment of financial data to make informed decisions. That’s where financial analysis comes in. But what exactly is financial analysis?
Financial analysis is the examination of financial statements to assess a company’s performance and guide decision-making. It uses techniques like ratio and trend analysis to evaluate profitability, and stability. This helps stakeholders understand financial health and make informed choices.
In this article, we will discuss the basics of financial analysis. It covers the types, ratios, tools and methods of financial analysis,and its importance in decision-making.
Key Takeaways
- Definition of Financial Analysis: Financial analysis is the assessment of financial data to evaluate company performance and make decisions.
- Financial Statements: It involves scrutinizing the balance sheets, income statements, and the cash flows statements.
- Analytical Tools: Common tools for financial analysis include ratio analysis, trend analysis, and forecasting.
- Decision Support: Financial analysis can help stakeholders make informed investment and business decisions.
- Strategic Insight: Financial analysis is essential for identifying financial strengths, weaknesses, and opportunities.
What Is Financial Analysis?
Financial analysis involves examining financial data to make decisions. This process helps businesses understand their financial health. Analysts look at financial statements to find a company’s value. Key elements include the balance sheets, income statements, and cash flow statements.
These documents show a company’s assets, debts, income, and expenses. Analysts use this information to see if a company is making money or losing money. This helps companies plan their future actions. Financial analysis is critical for business success. It tells if a company can pay its debts and grow.
Who Uses Financial Analysis?
Many people use financial analysis to make important decisions. Business owners look at financial analysis to understand their company’s performance. Investors use financial analysis to determine which companies to invest in. Banks examine financial data when deciding to give loans.
Managers rely on financial analysis to plan future expenses and growth. Government agencies also use it to understand economic trends. Thus, financial analysis is a tool used across various sectors to assess financial stability and make informed financial decisions.
Types Of Financial Analysis
Financial analysis is essential for understanding market trends and company performance. There are two main types: fundamental analysis and technical analysis. Each type uses different methods to evaluate stocks, businesses, or markets.
Fundamental Analysis
Fundamental analysis looks at economic and financial factors to assess a company’s value. It uses real data to evaluate a company’s future prospects. This type of analysis is crucial for long-term investment decisions.
Financial Statements Analysis
Financial statements analysis involves examining balance sheets, income statements, and cash flow statements. Analysts review these documents to understand a company’s financial stability, efficiency, and profitability.
For instance, a company might show $5 million in revenue and $1 million in net profit on its income statement, indicating a 20% profit margin. This analysis helps stakeholders gauge the company’s operational success over time.
Financial Ratios
Financial ratios are numerical comparisons of various figures from the financial statements. Common ratios include the debt-to-equity ratio, return on equity, and current ratio.
For example, if a company has total liabilities of $2 million and total equity of $5 million, its debt-to-equity ratio is 0.4. These ratios provide quick insights into financial health relative to industry standards or past performance.
Technical Analysis
Technical analysis focuses on studying market action primarily through the use of charts, for the purpose of forecasting future price trends. This analysis is often used for short-term investment decisions and trading.
Chart Patterns And Trends
Technical analysts study chart patterns and trends to predict future price movements in the market. Patterns like ascending triangles or descending triangles can indicate whether prices are likely to rise or fall.
Support And Resistance Levels
Support and resistance levels are key concepts in market psychology. Support levels are prices where a downward trend is expected to pause due to a concentration of demand.
Conversely, resistance levels are prices where an upward trend may stall due to a concentration of supply. For instance, if a stock repeatedly turns away from a price of $100, that price is considered a resistance level.
Head And Shoulders Pattern
The head and shoulders pattern is a chart formation that predicts a bullish-to-bearish trend reversal. It is identified by three peaks, with the middle peak (head) being the highest and the two outside peaks (shoulders) being lower and roughly equal.
The completion of this pattern typically leads to a significant price decline.
Moving Averages
Moving averages smooth out price data to identify trends. A simple moving average is calculated by averaging a stock’s price over a specific number of days.
For example, a 50-day moving average of a stock is derived by taking the average of its closing prices over the last 50 days. This indicator helps determine the direction of market momentum.
Technical Indicators
Technical indicators are mathematical calculations based on a stock’s price and/or volume. The results are used to forecast financial or economic trends. Common indicators include the RSI, MACD, and Bollinger Bands.
Relative Strength Index (RSI)
The RSI measures the magnitude of recent price changes to evaluate overbought or oversold conditions in the price of a stock or other asset.
An RSI above 70 typically suggests that a stock is overbought, while an RSI below 30 indicates that it may be oversold.
Moving Average Convergence Divergence (MACD)
The MACD is a trend-following momentum indicator. It shows the relationship between two moving averages of a stock’s price.
For example, the Moving Average Convergence Divergence (MACD) might be calculated by subtracting the 26-day exponential moving average from the 12-day exponential moving average.
Bollinger Bands
Bollinger Bands typically consist of a middle band being a simple moving average, with upper and lower bands calculated based on market volatility.
The bands widen during periods of increased volatility and narrow when volatility decreases, potentially signaling upcoming market moves.
Key Financial Statements
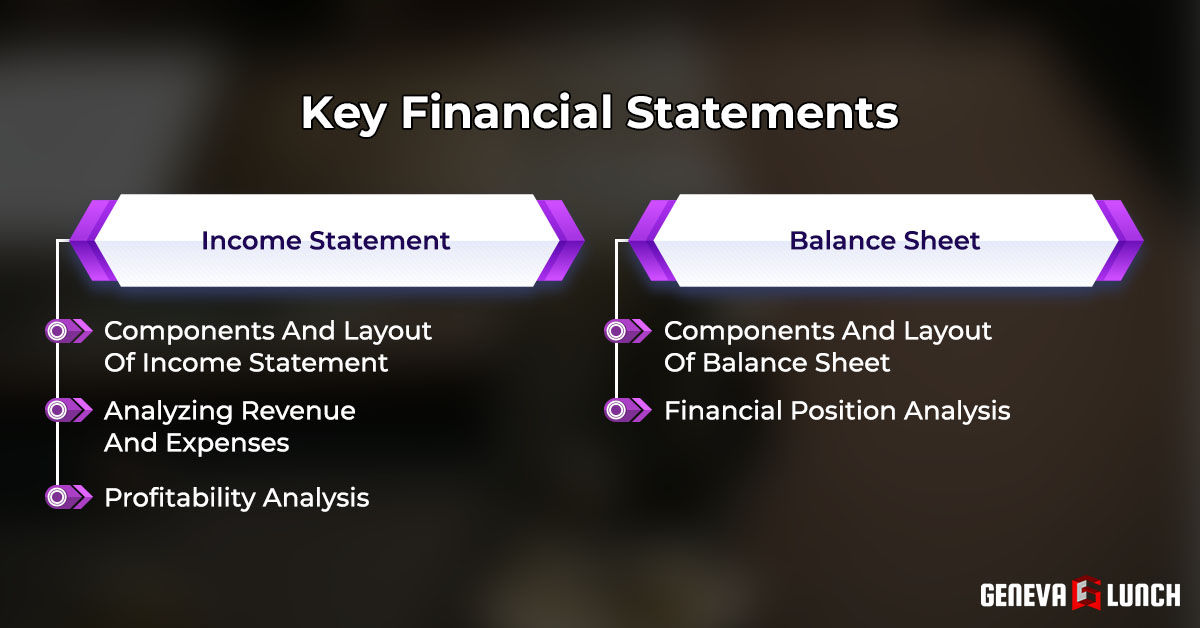
Financial statements are essential for understanding a company’s financial health. They include the income statement, balance sheet, and cash flow statement. Each document provides crucial information that helps stakeholders assess the financial status and performance of a business.
Income Statement
The income statement provides a summary of a company’s revenues, expenses, and profits over a specific period. An income statement is vital for assessing the operational efficiency and profitability of the business.
Components And Layout Of Income Statement
The income statement outlines a company’s revenues, expenses, and profits over a specific period. It begins with total revenue, followed by the cost of goods sold to arrive at gross profit.
Operating expenses are then listed and subtracted to determine operating profit. Finally, taxes and other expenses are deducted to reveal net income. For example, if a company reports $500,000 in total revenue and $450,000 in total expenses, the net income would be $50,000.
Analyzing Revenue And Expenses
This involves examining the sources of revenue and the nature of expenses. It helps identify areas where the company is spending more or earning less over time. Analyzing trends in these figures can indicate how well the company manages its operations.
For instance, a steady increase in revenue alongside stable expenses suggests effective cost management and business growth.
Profitability Analysis
Profitability analysis focuses on determining how profitably a company can generate revenue from its operations. It uses ratios like gross profit margin, operating margin, and net profit margin to measure efficiency.
For instance, a gross profit margin of 50% means that half of the total revenue remains as profit after covering the cost of goods sold.
Balance Sheet
The balance sheet is a snapshot of a company’s financial position at a specific point in time, listing assets, liabilities, and shareholders’ equity. It is essential for evaluating the company’s ability to meet its short-term and long-term financial obligations.
Components And Layout Of Balance Sheet
The balance sheet displays a company’s assets, liabilities, and shareholders’ equity at a particular moment. It is structured with assets on one side, and liabilities and equity on the other, ensuring both sides balance.
For example, if a company has assets worth $1 million, its liabilities and shareholders’ equity should also total $1 million to balance.
Financial Position Analysis
This analysis examines the company’s ability to pay off its debts with its assets at any given time. It considers ratios like the debt-to-equity ratio and the liquidity ratios to assess financial stability.
A lower debt-to-equity ratio, for example, indicates that a company is using less debt to finance its operations, which could mean a lower financial risk.
What Is Cash Flow Statement?
The cash flow statement outlines the cash inflows and outflows from operating, investing, and financing activities. It is key to understanding how well a company manages its cash to fund operations, invest in the business, and return value to shareholders.
Components And Layout Of Cash Flow Statement
The cash flow statement shows how changes in the balance sheet and income affect cash and the cash equivalents.
It breaks down the analysis into categories like operating, investing, and financing activities. Thus, it shows the cash inflows and outflows for each category.
Cash Flow Categories
This part of the statement categorizes cash flows into operating, investing, and financing activities. Each category explains different aspects of cash flow, showing how cash moves in and out of the business.
Operating Activities
Operating activities include cash received from sales and cash paid for goods and services. They reflect the cash inflows and outflows from the company’s primary business operations.
For example, receiving cash from customers of $300,000 and paying suppliers $150,000 results in a net cash flow from operating activities of $150,000.
Investing Activities
Investing activities involve purchases and sales of long-term assets, like buildings and machinery, and investments in securities. For example, if a company spends $100,000 on new factory equipment, this is recorded as a cash outflow.
It shows how a company invests in its future operations and manages its long-term assets, impacting its financial growth and operational capacity.
Financing Activities
Financing activities include transactions involving raising money through borrowing or issuing equity and repaying debts. For instance, if a company issues new shares and raises $200,000, this is recorded as a cash inflow under financing activities.
These activities demonstrate how the company manages its capital structure, supports expansion, and provides returns to its shareholders, influencing its overall financial health.
Cash Flow Analysis
Analyzing the cash flow statement helps assess the company’s liquidity, solvency, and financial flexibility. By examining cash flows, analysts can determine whether a company is on solid financial footing.
Positive cash flow from operating activities, for example, suggests that the business is generating sufficient revenue to sustain its operations and invest in growth.
Financial Ratios
Financial ratios are critical tools that help analyze a company’s financial health and operational efficiency. They provide insights into various facets of company performance such as profitability, liquidity, leverage, and efficiency.
Profitability Ratios
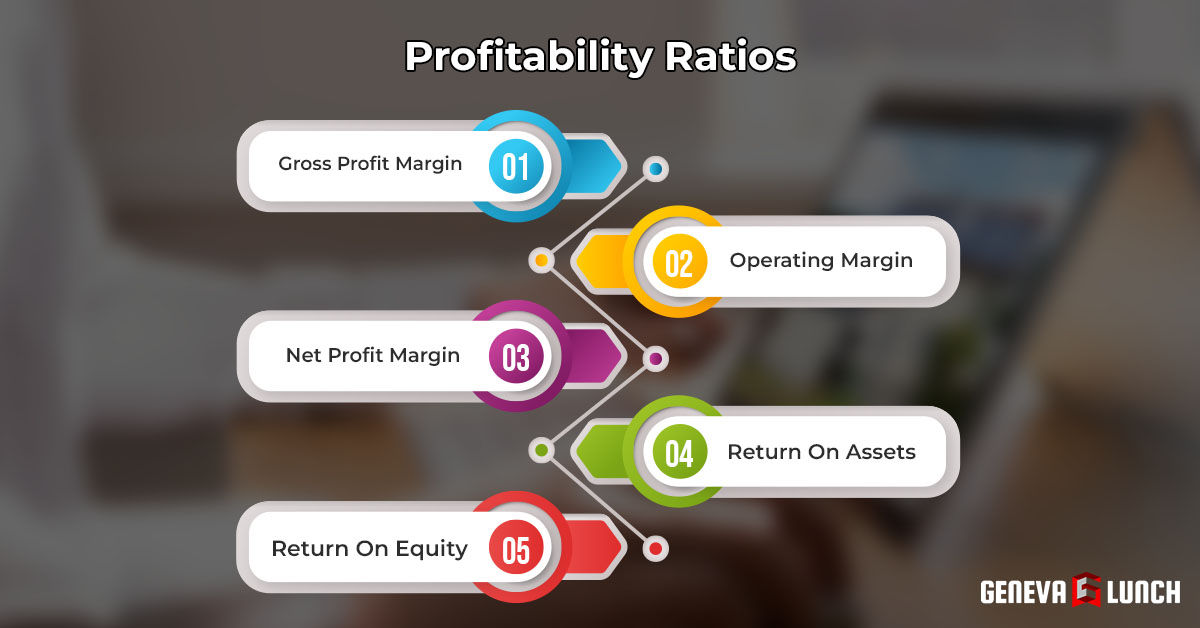
Profitability ratios assess how effectively a company can generate profit from its operations. These ratios are critical for investors and analysts to understand how well a company utilizes its resources to produce earnings.
Gross Profit Margin
The gross profit margin quantifies how much of every dollar of revenue is retained as gross profit after accounting for the cost of goods sold.
For example, if a company has revenue of $100,000 and costs of goods sold of $60,000, its gross profit margin is 40%. This ratio is vital for assessing the efficiency with which a company produces its goods and services.
Operating Margin
The operating margin reflects the proportion of revenue remaining after deducting operating expenses. For example if a company’s sales are $100,000 and operating expenses are $80,000, resulting in operating income of $20,000, the operating margin would be 20%.
This measure helps gauge how well a company controls its operational costs and manages its day-to-day operations.
Net Profit Margin
Net profit margin indicates how much net income is generated from a company’s total revenue. For example, if net income is $10,000 from $100,000 in revenue, the net profit margin would be 10%.
It shows how effectively a company can convert revenue into profit after all expenses.
Return On Assets (ROA)
Return on Assets shows how efficiently a company’s assets generate profit. For example, an ROA of 8% implies that the company generates $8 of net income for every $100 in assets.
It is crucial for evaluating asset utilization irrespective of the company’s financing structure.
Return On Equity (ROE)
Return on Equity assesses the profitability generated from shareholders’ equity. For example, an ROE of 15% means for every $100 of equity, the company generates $15 in profit.
This ratio is key for investors as it shows how effectively their capital is being used.
Liquidity Ratios
Liquidity ratios evaluate a company’s ability to meet its specific short-term obligations. Liquidity ratios are essential for determining the financial flexibility of a business, especially under immediate financial stress.
Current Ratio
The current ratio measures a company’s ability to cover its short-term obligations with its short-term assets.
A current ratio of 1.5 suggests that the company has $1.50 in current assets for every $1 of current liabilities. It is an essential indicator of financial stability in the short term.
Quick Ratio
The quick ratio, or acid-test ratio, strips out less liquid current assets like inventory from the equation. For instance, if liquid assets are $75,000 and current liabilities are $50,000, the quick ratio would be 1.5.
This ratio is a stricter test of liquidity, showing how well a company can meet immediate obligations.
Cash Ratio
Cash ratio provides an even stricter assessment by comparing only cash and cash equivalents to current liabilities. A cash ratio of 0.5 means there are 50 cents in cash for every dollar of liabilities.
It demonstrates a company’s ability to settle short-term debts with cash on hand, indicating extreme financial security.
Leverage Ratios
Leverage ratios measure the extent of a company’s reliance on debt financing. It helps assess the risk associated with the financial structure of a company. Understanding these ratios is very crucial for maintaining the financial health of a company.
Debt-To-Equity Ratio
The debt-to-equity ratio provides insight into a company’s debt levels compared to its equity. If a company has total liabilities of $200,000 and shareholders’ equity of $100,000, the debt-to-equity ratio would be 2.0.
This ratio is crucial for assessing the degree of financial leverage and risk.
Debt-To-Asset Ratio
This ratio shows how much of a company’s assets are financed by debt. A debt-to-asset ratio of 0.6 means 60% of the company’s assets are financed through debt.
It helps investors understand how much the company relies on borrowing to fund its operations.
Interest Coverage Ratio
The interest coverage ratio measures a company’s ability to handle its debt obligations by comparing its earnings before interest and taxes (EBIT) to its interest expenses.
An interest coverage ratio of 4 indicates the company earns four times its interest expenses, suggesting strong solvency.
Efficiency Ratios
Efficiency ratios analyze how well a company utilizes its assets. They also assess how the company manages its operations. These ratios are vital for evaluating operational performance and asset management.
Asset Turnover Ratio
This ratio examines how effectively a company uses its assets to generate sales. For instance, if total sales are $500,000 and average assets are $250,000, the asset turnover ratio would be 2.
This means the company generates twice the amount of its assets in sales, indicating high asset efficiency.
Inventory Turnover Ratio
The inventory turnover ratio shows how often a company sells and replaces its inventory in a period.
For example, if the cost of goods sold is $100,000 and average inventory is $20,000, the turnover ratio is 5. This ratio is important for evaluating inventory management and operational efficiency.
Receivables Turnover Ratio
Receivables turnover ratio generally indicates how quickly a company collects on its outstanding accounts receivable.
For example, a receivables turnover ratio of 10 means the company collects its average receivables 10 times a year. It demonstrates effective credit and collection policies.
Financial Analysis Tools And Techniques
Financial analysis tools and techniques are essential for evaluating a company’s performance and making investment decisions. These tools range from financial modeling to scenario analysis, each providing unique insights into the financial health of businesses.
Financial Modeling
Financial modeling is a powerful tool used to forecast a company’s financial performance. Using historical data, analysts build models. These models help them make informed predictions about the company’s future financial conditions.
Types Of Financial Models

There are several types of financial models used by analysts to forecast financial performance and assess the value of companies. These models are designed for specific purposes and vary based on the financial analysis needs:
- Three-Statement Model: This model combines the income statement, balance sheet, and cash flow statement to provide a comprehensive overview of a company’s financial health.
- Discounted Cash Flow (DCF) Model: The DCF model calculates a company’s value by estimating its future cash flows and bringing them back to their present value.
- Leveraged Buyout (LBO) Model: Used primarily in private equity and corporate finance, LBO model is often used to see how buying a company mostly with borrowed money might pay off.
Each model has its unique application, helping analysts and investors make informed decisions based on the financial data and scenarios they are investigating.
Which Choice Is A Best Practice In Financial Modeling?
A best practice in financial modeling is to keep the model simple and transparent, ensuring assumptions are clear and justifiable. It’s also crucial to use consistent and reliable data sources and to regularly update the model as new data becomes available.
For example, using actual historical data for the past 5 years as a base for projections can provide a realistic outlook for future financial statements.
Valuation Methods
Valuation methods are essential in determining the worth of a company or asset. They help investors and companies make decisions about acquisitions. They can also be helpful when it comes to deciding on investments and mergers.
Discounted Cash Flow (DCF) Analysis
DCF analysis estimates the value of an investment based on its expected future cash flows, adjusted for the time value of money. The key to DCF analysis is determining the discount rate to apply to future cash flows, which often involves the weighted average cost of capital (WACC).
For instance, if a company’s future cash flows are projected at $100,000 annually for 5 years, and the discount rate is 10%, the present value of these cash flows can be calculated to assess the investment’s worth.
Comparable Company Analysis
This method values a company based on the metrics of similar companies in the same industry. For example, if comparable companies are valued at an average of 10 times earnings, and a company earns $1 million per year, it may be valued at approximately $10 million.
This approach is commonly used for assessing market competitiveness and investment attractiveness.
Precedent Transactions Analysis
This technique looks at prices paid for similar companies in past transactions to gauge a target company’s value. It involves analyzing deal multiples, structures, and premiums paid in recent acquisitions within the same industry.
For example, if recent transactions show an average acquisition premium of 30%, this can guide the premium an acquirer might expect to pay.
Ratio Analysis
Ratio analysis simplifies complex financial reports into understandable ratios, making it easier to evaluate the financial condition and performance of a company.
Importance Of Ratio Analysis
Ratio analysis is crucial for assessing a company’s financial condition, operational efficiency, and profitability by comparing quantitative aspects of its financial statements.
It helps in benchmarking against competitors and industry standards, providing a clear picture of financial health and areas needing improvement.
What Are The Types Of Ratio Analysis?
The main types of ratio analysis include liquidity ratios, profitability ratios, leverage ratios, and efficiency ratios. Each type focuses on different aspects of financial health. For instance, liquidity ratios assess the ability to cover short-term obligations, while profitability ratios measure the ability to generate profits from resources.
Each type of ratio provides specific insights, allowing analysts to assess different aspects of the company’s financial health and performance.
Sensitivity Analysis
Sensitivity analysis explores how the variation in the output of a model can be attributed to different variations in the inputs. This analysis is crucial for understanding the risk associated with particular variables.
Definition And Purpose Of Sensitivity Analysis
Sensitivity analysis examines how the uncertainty in the output of a model can be apportioned to different sources of uncertainty in its inputs.
This analysis helps identify which inputs are most influential on the outcome and where uncertainties lie, facilitating better decision-making under uncertainty.
Steps In Conducting Sensitivity Analysis
The process involves identifying key inputs, defining a range for these inputs, running the model using different input combinations, and observing changes in the output.
For example, adjusting the discount rate in a DCF model to see how it affects the valuation helps understand the model’s sensitivity to changes in the cost of capital.
Scenario Analysis
Scenario analysis helps in planning by simulating different future states of the world. It allows companies to visualize all the potential outcomes. This way, they can plan strategically to avoid risks.
Definition And Purpose Of Scenario Analysis
Scenario analysis is used to explore different hypothetical events by altering key variables to see how those changes could impact the outcome.
This technique helps in planning for uncertainties. They can also help in assessing the potential impact of different strategies, and enhancing strategic planning.
Steps In Conducting Scenario Analysis
The steps include defining the scope of the analysis, identifying the key factors and their baseline values, developing different scenarios (e.g., best-case, worst-case, and most likely case), running the analysis for each scenario, and comparing the outcomes to understand potential impacts.
For instance, a company may assess the financial impacts of market growth rates varying from 2% to 8% to plan for various market conditions.
Financial Analysis In Practice
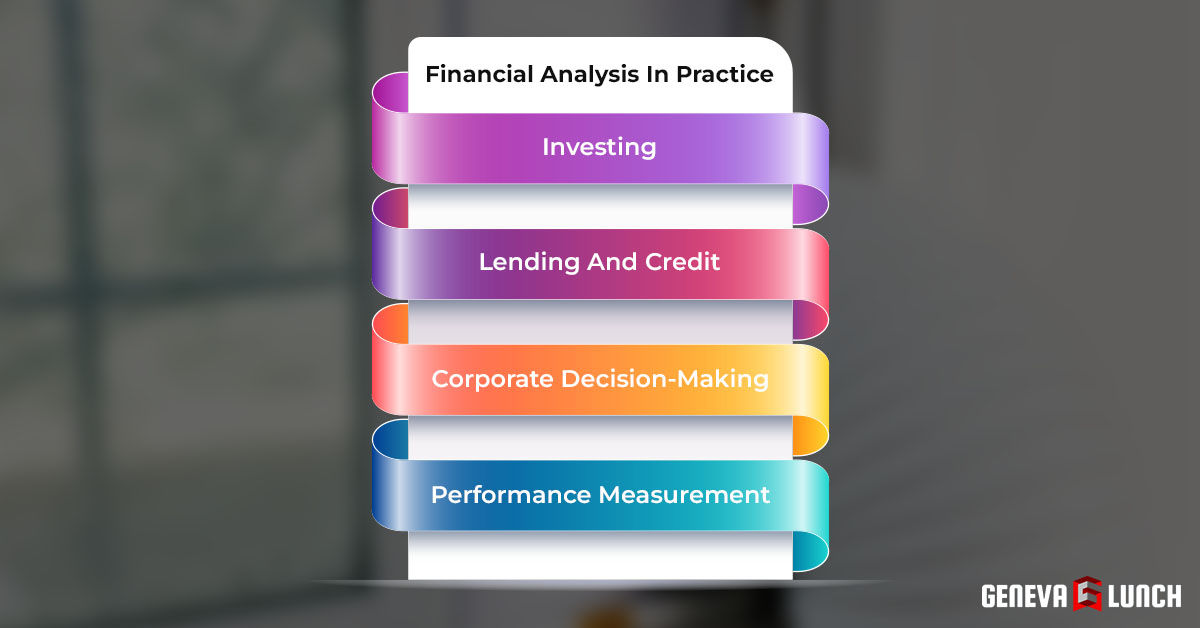
Financial analysis is a critical tool across various business areas, helping organizations make informed decisions based on data and projections. It plays a pivotal role in investing, lending, corporate decision-making, and measuring performance. Here’s how financial analysis is applied in practical settings:
Investing
Financial analysis helps investors make informed decisions by evaluating potential returns and risks associated with different investment opportunities. Analysts use tools like DCF models and ratio analysis to predict future cash flows and determine the intrinsic value of stocks, bonds, or other investment vehicles.
For instance, an investor may analyze the Price-to-Earnings (P/E) ratio of a stock to decide whether it’s priced appropriately given its earnings prospects.
Lending And Credit
In lending and credit, financial analysis is used to assess the creditworthiness of borrowers. Banks and other financial institutions analyze financial statements, credit scores, and other financial metrics to determine the likelihood of a borrower defaulting on a loan.
For example, a bank might look at a company’s debt-to-equity ratio to decide whether to approve a business loan.
Corporate Decision-Making
Corporations rely on financial analysis to make strategic decisions such as expansions, acquisitions, or divestitures. By examining financial statements and conducting valuation assessments, companies can identify profitable ventures and avoid potential financial pitfalls.
A typical example is a company performing a break-even analysis before launching a new product to ensure profitability.
Performance Measurement
Financial analysis is essential for measuring a company’s performance over time. It enables businesses to track their financial health, operational efficiency, and progress towards strategic goals.
Performance metrics like ROE (Return on Equity) and EBITDA (Earnings Before Interest, Taxes, Depreciation, and Amortization) are commonly used to evaluate the effectiveness of business strategies and operational management.
Advanced Financial Analysis Techniques
Advanced financial analysis techniques allow analysts to dig deeper into data, uncover trends, predict future financial outcomes, and identify relationships between variables. These techniques include time series analysis, regression analysis, and Monte Carlo simulations, each providing unique insights through different statistical methods.
Time Series Analysis
Time series analysis looks at data points over time to help understand how a variable changes. This analysis is essential for identifying trends and patterns that occur regularly.
Trend Analysis
Trend analysis examines data points over time to determine if there is an upward, downward, or neutral trend in the data.
For instance, an analyst might look at quarterly sales data over several years to see if there is a consistent increase in sales, indicating a positive trend.
Seasonality Patterns
Seasonality analysis identifies patterns that repeat over a specific period, such as weeks, months, or quarters. This is common in businesses affected by seasonal factors.
For example, a retailer might experience higher sales during holiday seasons and analyze these patterns to plan inventory and staffing.
Regression Analysis
Regression analysis is utilized to examine the relationship between a dependent variable and one or more independent variables. It helps in predicting the effect of the independent variables on the dependent variable.
Simple And Multiple Regression
Simple regression involves two variables, one independent and one dependent, to see how they interact. Multiple regression uses more than one independent variable to analyze their impact on the dependent variable.
For example, a company may use multiple regression to understand how both advertising spend and store location impact sales.
Analyzing Relationships Between Variables
Analyzing the relationships between the variables can help determine the strength and nature of the relationship between variables.
For instance, it can show how changes in commodity prices affect a company’s stock prices. This can be helpful in predicting future movements.
Monte Carlo Simulation
Monte Carlo simulation uses probability modeling to predict possible outcomes in financial decision-making, providing a range of potential future results. This makes it valuable for risk assessment and decision-making under uncertainty.
Probability Distributions
This technique typically involves using the known probabilities to simulate different outcomes in a process.
For example, the technique could be used to model the risk of investment portfolios under various market conditions by assigning probabilities to different market movements.
Predicting Financial Outcomes
Monte Carlo simulations help forecast complex financial scenarios by simulating a wide range of possible outcomes based on random variables.
For example, a financial analyst might use this method to estimate the potential future prices of a stock, taking into account volatility, interest rates, and other economic factors, to inform investment decisions.
FAQs
What Are The Objectives Of Financial Analysis?
The objectives of financial analysis are to assess a company’s profitability, stability, and viability over time. It helps stakeholders understand how well a company manages its resources, if it can pay off debts, and how it can maximize profits. It provides insights that guide management decisions.
Who Prepares Financial Analysis?
Financial analysis is usually prepared by financial analysts, accountants, or finance managers and chartered financial analysts. These professionals use their skills to interpret financial data, helping senior management understand the company’s financial condition and make informed decisions.
Why Are Ratios Important In Financial Analysis?
Ratios are important in financial analysis because they provide quick insights into a company’s financial health and performance by comparing different financial metrics. They help in assessing liquidity, profitability, leverage, and efficiency. They can show how well a company is performing.
What Role Does Financial Analysis Play In Business Decision-Making?
Financial analysis plays a critical role in business decision-making by providing detailed data on a company’s financial health. It supports strategic planning by forecasting future performance and assessing the impact of potential decisions. It helps businesses ensure sustainability and growth.
What Are The Limitations Of Financial Analysis?
The limitations of financial analysis can include its reliance on historical data, which may not accurately predict future conditions. Financial analysis also doesn’t account for non-financial factors like market conditions or management expertise, which can impact a company’s performance.
Final Words
Financial analysis is vital for understanding and managing money wisely. By examining financial statements and using tools like ratio analysis, anyone from business managers to individual investors can make smarter financial decisions in managing their finances. This process helps in spotting trends, assessing risks, and planning for the future effectively.